Java 25 Starts Your Spring Boot App 2x Faster. Here’s How
Java 25 can bring a typical Spring Boot service up in about half the time, with one extra step in the build. I measured five popular ways to start Java faster on the same application, starting each one at least 10 times and testing it under load, to see how much each one helps and where it matters most.
Where faster startup helps
So where does a faster start really make a difference? Mostly in places where Java starts often, or where someone is waiting for it to come up. Here are the common ones:
- Kubernetes recovery: when a node fails, its pods are back up on other nodes sooner.
- Scaling under traffic: when traffic grows and more JVMs or pods are started on the fly to handle it, each new one is ready to take load sooner.
- Command-line tools and short jobs: a
CommandLineRunner - Desktop applications: a Java desktop app, such as a Swing or JavaFX tool or an IDE, opens its window sooner after you start it.
- Serverless and scale-to-zero: shorter cold starts (the first start after the app was stopped while idle), so the first request waits less.
- Tests and local development: every restart of the application context is faster.
The short answer
Started the usual way, with java -jar app.jar
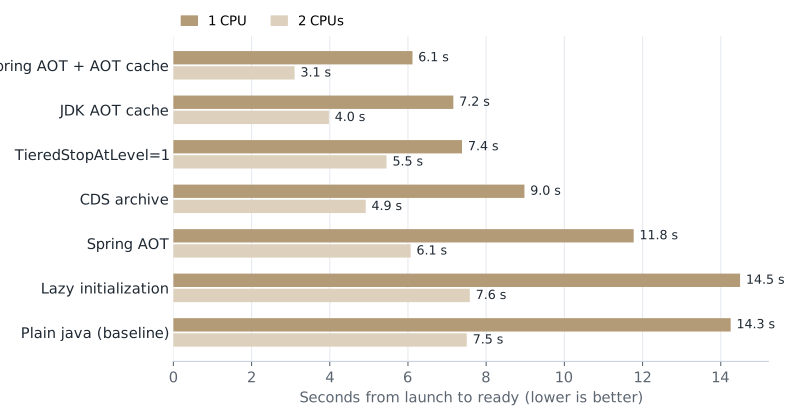
| Option | Ready, 1 CPU | Ready, 2 CPUs | Extra build step |
|---|---|---|---|
Plain java | 14.3 s | 7.5 s | None |
| Lazy initialization | 14.5 s | 7.6 s | None (one property) |
| Spring AOT | 11.8 s | 6.1 s | AOT processing at build time (9 s here) |
| CDS archive | 9.0 s | 4.9 s | One training run (10 s here) |
-XX:TieredStopAtLevel=1 | 7.4 s | 5.5 s | None (one flag), but half the speed or less once warm |
| JDK AOT cache | 7.2 s | 4.0 s | One training run (17 s here) |
| Spring AOT + JDK AOT cache | 6.1 s | 3.1 s | Both of the above |
What to use. On Java 25, start with the JDK AOT cache for the biggest gain from one build step, and add Spring AOT for more. On Java 21, CDS is the best option. It is about a third faster, with the same kind of training run. The flag -XX:TieredStopAtLevel=1
What AOT means here
AOT stands for ahead of time, meaning work that is done before the application runs, instead of while it starts. Two of the options below have AOT in their name, and they are different things:
- Spring AOT runs at build time. It works out how to create every bean and writes that down as plain Java code, so Spring does not have to figure it out again at each start.
- The JDK AOT cache comes from a training run. The JVM starts the application once, records the classes it loaded and linked and the methods that got hot (the methods that ran most often), and saves them in a file that later starts read.
Neither one compiles your application to a native executable. That is what GraalVM native image does, covered at the end. Both still run on a normal JVM with its JIT compiler.
What was measured
The test application is a small shop service built with Spring Boot 4.1.2, Spring MVC, Jackson, Bean Validation, Actuator and Spring Data JPA with Hibernate on an in-memory H2 database. It has four entities, four repositories and five endpoints. It is started from the extracted layout (an app.jarlib
For each option I measured three things, with the JVM pinned to 1 CPU and to 2 CPUs:
- Time to ready: from launching
java/actuator/health/readiness - Warm-up at a steady rate: 300 requests per second from the moment the app is ready, with latency recorded per 5-second window. Five runs each.
- Full load from the first request: 16 connections sending requests back to back for 120 seconds, counting completed requests. Five runs each.
The machine is small on purpose (2 vCPUs, 7 GB RAM), because that is where startup and warm-up hurt most, as in a container with a CPU limit of 1 or 2. Every number in this post is a median from those runs, and the
1. CDS: load classes from an archive
Class Data Sharing stores classes that the JVM has already loaded, parsed and verified in an archive file. At startup the JVM maps the file into memory instead of reading and checking every class from the JARs again. Spring Boot documents a training run that starts the application, stops it as soon as the context is refreshed, and writes the archive on exit:
# training run: start, exit after the context refresh, write the archive
java -XX:ArchiveClassesAtExit=app.jsa -Dspring.context.exit=onRefresh -jar app.jar

# every later start
java -XX:SharedArchiveFile=app.jsa -jar app.jar
With the archive, time to ready dropped from 14.3 s to 9.0 s at 1 CPU (37%) and from 7.5 s to 4.9 s at 2 CPUs (34%). Throughput in the first two minutes under load stayed the same as plain java
The archive only works with the same JDK build and the same class path, so create it in the same image the app runs in, usually as a step in the Dockerfile. If anything differs, the JVM ignores the archive and starts as slowly as before.
2. The JDK AOT cache: CDS and more
The AOT cache from Project Leyden builds on CDS, and Spring Boot recommends it over CDS on Java 25 and later. On top of the parsed classes, it stores classes already loaded and linked (
# training run: the cache is written when the JVM exits
java -XX:AOTCacheOutput=app.aot -Dspring.context.exit=onRefresh -jar app.jar

# every later start
java -XX:AOTCache=app.aot -jar app.jar
With -Xlog:aot
[0.005s][info][aot] Opened AOT cache app-refresh.aot.This was the best single option for startup. Time to ready was 7.2 s at 1 CPU and 4.0 s at 2 CPUs, about half of plain java
plain java:     Started ShopApplication in 6.294 seconds (process running for 6.841)
with AOT cache: Started ShopApplication in 3.123 seconds (process running for 3.626)
The cache is 120 MB. A cache trained under real traffic for 60 seconds instead of stopping at the context refresh was 141 MB and started equally fast.
Like the CDS archive, the cache only works with the same JDK build and class path. If your service takes heavy traffic the moment it starts, read
3. Spring AOT: do the bean wiring at build time
At startup, Spring scans the class path, evaluates conditions and works out how to create each bean, mostly with reflection (code that looks inside classes while the program runs). Spring AOT does that work at build time and generates plain Java code that registers the beans directly. The Spring Boot Maven and Gradle plugins run it (process-aotprocessAot
java -Dspring.aot.enabled=true -jar app.jarOn its own, Spring AOT took time to ready from 14.3 s to 11.8 s at 1 CPU (17%) and from 7.5 s to 6.1 s at 2 CPUs (19%). That is less than CDS, but it adds to the AOT cache. Together they reached 6.1 s and 3.1 s, the fastest setup measured, and the lowest memory at ready of the full-speed setups (265 MB against 299 MB for plain java
The price is that the bean definitions are fixed at build time. Conditions such as @ConditionalOnProperty
4. Lazy initialization: no gain for a web service
Setting spring.main.lazy-initialization=true
java -Dspring.main.lazy-initialization=true -jar app.jarIt made no measurable difference here, with 14.5 s against 14.3 s at 1 CPU and 7.6 s against 7.5 s at 2 CPUs. Most of the startup time in a typical service goes to beans that are needed before the app can report ready anyway, such as the web server, the data source, Hibernate and the repositories. Lazy initialization only defers the rest, and pays for it on the first requests.
It also moves failures later. A bean that fails to start now fails on the first request that needs it, after the readiness probe has already passed.
5. TieredStopAtLevel=1: fast to start, slow forever
HotSpot compiles hot methods in tiers, first with the quick C1 compiler and then, for the hottest methods, with the optimizing C2 compiler. -XX:TieredStopAtLevel=1
java -XX:TieredStopAtLevel=1 -jar app.jarIt does start fast, with 7.4 s at 1 CPU, close to the AOT cache, and 5.5 s at 2 CPUs. It also had the best latency in the first minute at a steady rate. But once warm, the service handled 991 requests per second at 1 CPU against 2,073 for plain java
That loss never goes away, so never use this flag for a service or any long-running process. It suits processes that finish within seconds, such as tests, local development restarts, small command-line tools, and a CommandLineRunner
Beyond the JVM: native images and CRaC
Two more approaches make startup almost instant, but they change much more than a flag. Here is what each one does and how to try it with Spring Boot.
GraalVM native image
A native image is the application compiled ahead of time into a native executable. Startup drops to a fraction of a second and memory use is lower. The trade-offs are long builds, the configuration that reflection and dynamic proxies need (Spring AOT generates most of it), and a peak throughput that is usually lower than the JIT's unless profile-guided optimization is used.
To build one, install a GraalVM distribution for JDK 25, such as Liberica Native Image Kit 25, and use the native
# build the native executable into target/
mvn -Pnative native:compile
# start it (the file is named after the project)
target/myproject
With Gradle, the task is gradle nativeCompilebuild/native/nativeCompilemvn -Pnative spring-boot:build-image
CRaC
CRaC (Coordinated Restore at Checkpoint) takes a snapshot of a running JVM and restores it later, so the new process starts where the old one stopped, already warm if it had served traffic. It works on Linux only and needs a JDK build with CRaC, such as Azul Zulu or BellSoft Liberica with CRaC, plus the org.crac:crac
The simplest way, described in the
# take the snapshot once the context is refreshed
java -Dspring.context.checkpoint=onRefresh -XX:CRaCCheckpointTo=./checkpoint -jar app.jar
# every later start restores from it
java -XX:CRaCRestoreFrom=./checkpoint
To snapshot a warmed-up application instead, start it with -XX:CRaCCheckpointTo=./checkpointjcmd app.jar JDK.checkpoint
One thing to check under heavy load
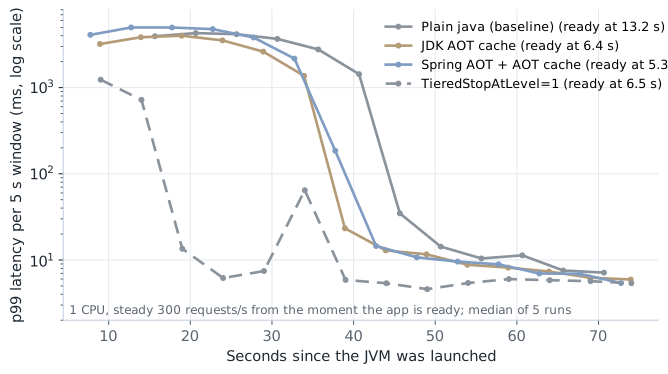
Startup time is only half of what a new instance needs. When it reports ready, its code is still mostly interpreted, and it serves requests slowly until the JIT compiler has compiled the hot paths. A new pod that joins a busy service, for example after a scale-up, takes its share of traffic right away.
So I measured the first two minutes of each setup under full load, starting the moment the app reported ready. CDS behaved like plain java
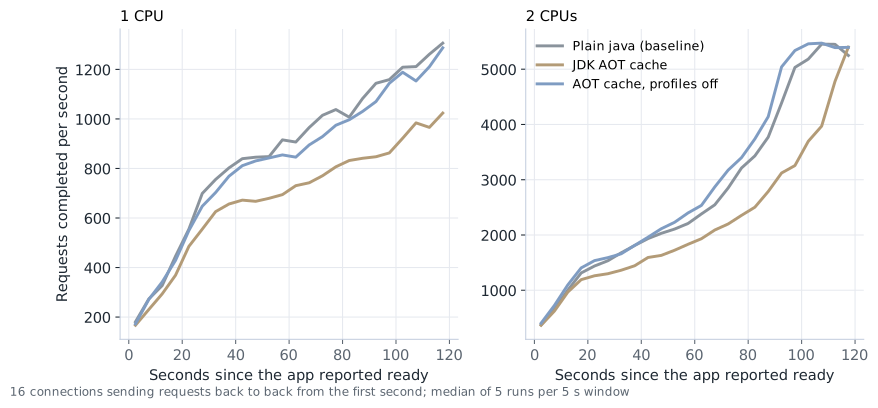
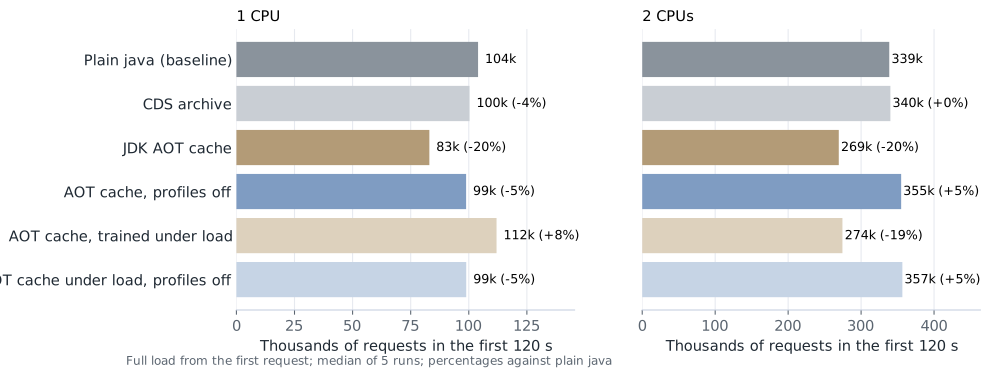
With the cache trained to startup only (stopped at the context refresh), the service completed 20% fewer requests than plain java
The cause is the method profiles. JDK 25 replays the profiles stored in the cache by default, and a diagnostic flag turns that off while keeping everything else the cache does. With the same cache file and replay off, startup stayed as fast and the first two minutes were 5% better than plain java
java -XX:AOTCache=app.aot \
     -XX:+UnlockDiagnosticVMOptions -XX:-AOTReplayTraining \
     -jar app.jar
The JIT compiler's own statistics (-XX:+CITime
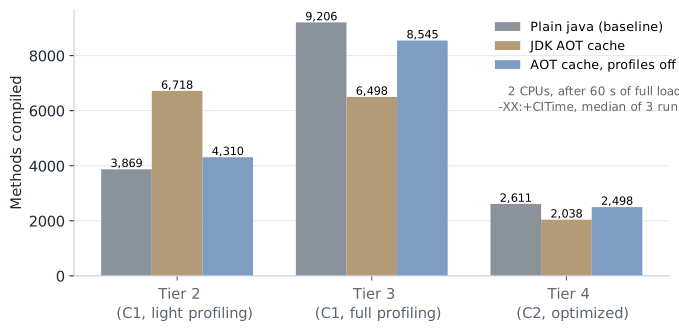
-XX:+CITimeWith the profiles, 6,718 methods were compiled at tier 2, a C1 level that collects little profiling data, against 3,869 for plain javajava
Why do so many methods stay at tier 2? When C2 is busy, the JVM compiles some methods at tier 2 to save work, and normally moves them on to tier 3 later, so they can collect a full profile and reach C2. With training data in the cache, that safety net is switched off. This is a known bug in JDK 25, and the same warm-up loss shows up in
Two more details from the runs:
- Training under real traffic helped on 1 CPU but not on 2. A cache trained with 60 seconds of requests served 8% more than plain
java - At a moderate steady rate the effect is smaller. At 300 requests per second, every setup settled within 10 seconds at 2 CPUs. At 1 CPU, Spring AOT with the AOT cache started fastest but had the worst latency in its first minute after ready (p99 of 4.8 s against 4.0 s for plain
javajava
None of this makes the AOT cache a bad choice. It halves startup, and for most services that matters more. It does mean that "startup time" is the wrong thing to measure alone. If you use the cache and new instances take full traffic at once, compare the first minutes under load with and without it, and treat -XX:-AOTReplayTraining
On Kubernetes, this is the window in which the
Method
- Machine: a cloud VM with 2 vCPUs and 7 GB of RAM, Linux 6.18. OpenJDK 25.0.5 (Ubuntu build 25.0.5.0.3), Spring Boot 4.1.2, Hibernate on in-memory H2.
- CPU pinning: with
taskset - Load: a small C load generator using
epoll - Runs: 200 startup runs (10 per setup and CPU count), 100 steady-rate runs and 60 full-load runs (5 each), executed one at a time and round-robin across setups, so slow drift affects all of them alike. Every number is a median. The compiler statistics are from separate runs with
-XX:+CITime - Training: CDS and the AOT caches were each created by one training run on the same machine, with the same JDK and class path.
Recap
- The JDK AOT cache gave the biggest startup gain, about half the time to ready, for one training run in the build. With Spring AOT on top, startup was almost 60% faster.
- CDS cut startup by about a third and works on Java 21 and older.
- It matters most where Java starts often, such as Kubernetes recovery and scaling, command-line tools, desktop applications, serverless and tests.
- Lazy initialization made no difference for a web service, and
TieredStopAtLevel=1 - Under heavy load right after startup, check the first minutes as well as the startup time. On JDK 25 the cache's method profiles slowed warm-up in that case, and turning profile replay off removed it.