CloudWatch console home page by default shows you metrics about AWS services you currently use. Additionally you can create custom dashboards to display metrics about your applications and AWS resources, and display custom collections of metrics that you choose. CloudWatch gives you complete visibility into resource utilization, application performance, and operational health.
More information on CloudWatch can be found here
Using CloudWatch metrics, you can create alarms to send alerts or automatically make changes to your resources when a breach condition is triggered. For example, say you are running an application on EC2 instances and you want to monitor the CPU usage and other resources consumption of your EC2 instances and if there is an increased load, then use that data to determine whether you should launch additional instances to handle increased load. You can also use this data to shut down EC2 instances when they are under utilized due to no work load.
-
When you open CloudWatch console, it shows you a Overview screen as shown below.
You can also navigate to other dashboards from the overview drop down and change the timeline to show the metrics since that time.
On the left side, you can navigate to below sections
- Alarms : This section shows alarms that you have created, you can also filter based on several flags, like alarm state and hide certain alarms etc.
- Logs : From this section, you can browse CloudWatch logs by log groups and create new log groups. You can also query logs using Logs Insights and save these queries.
- Metrics : From this section, you can browse through all the metrics plus look at metric streams.
-
X-Ray traces : From this section, you can view the map of services and associated traces for requests
that your applications serve, and to configure groups and sampling rules which affect how traces are sent to X-Ray.
More information og AWS X-Ray console can be found here
AWS X-Ray Console .
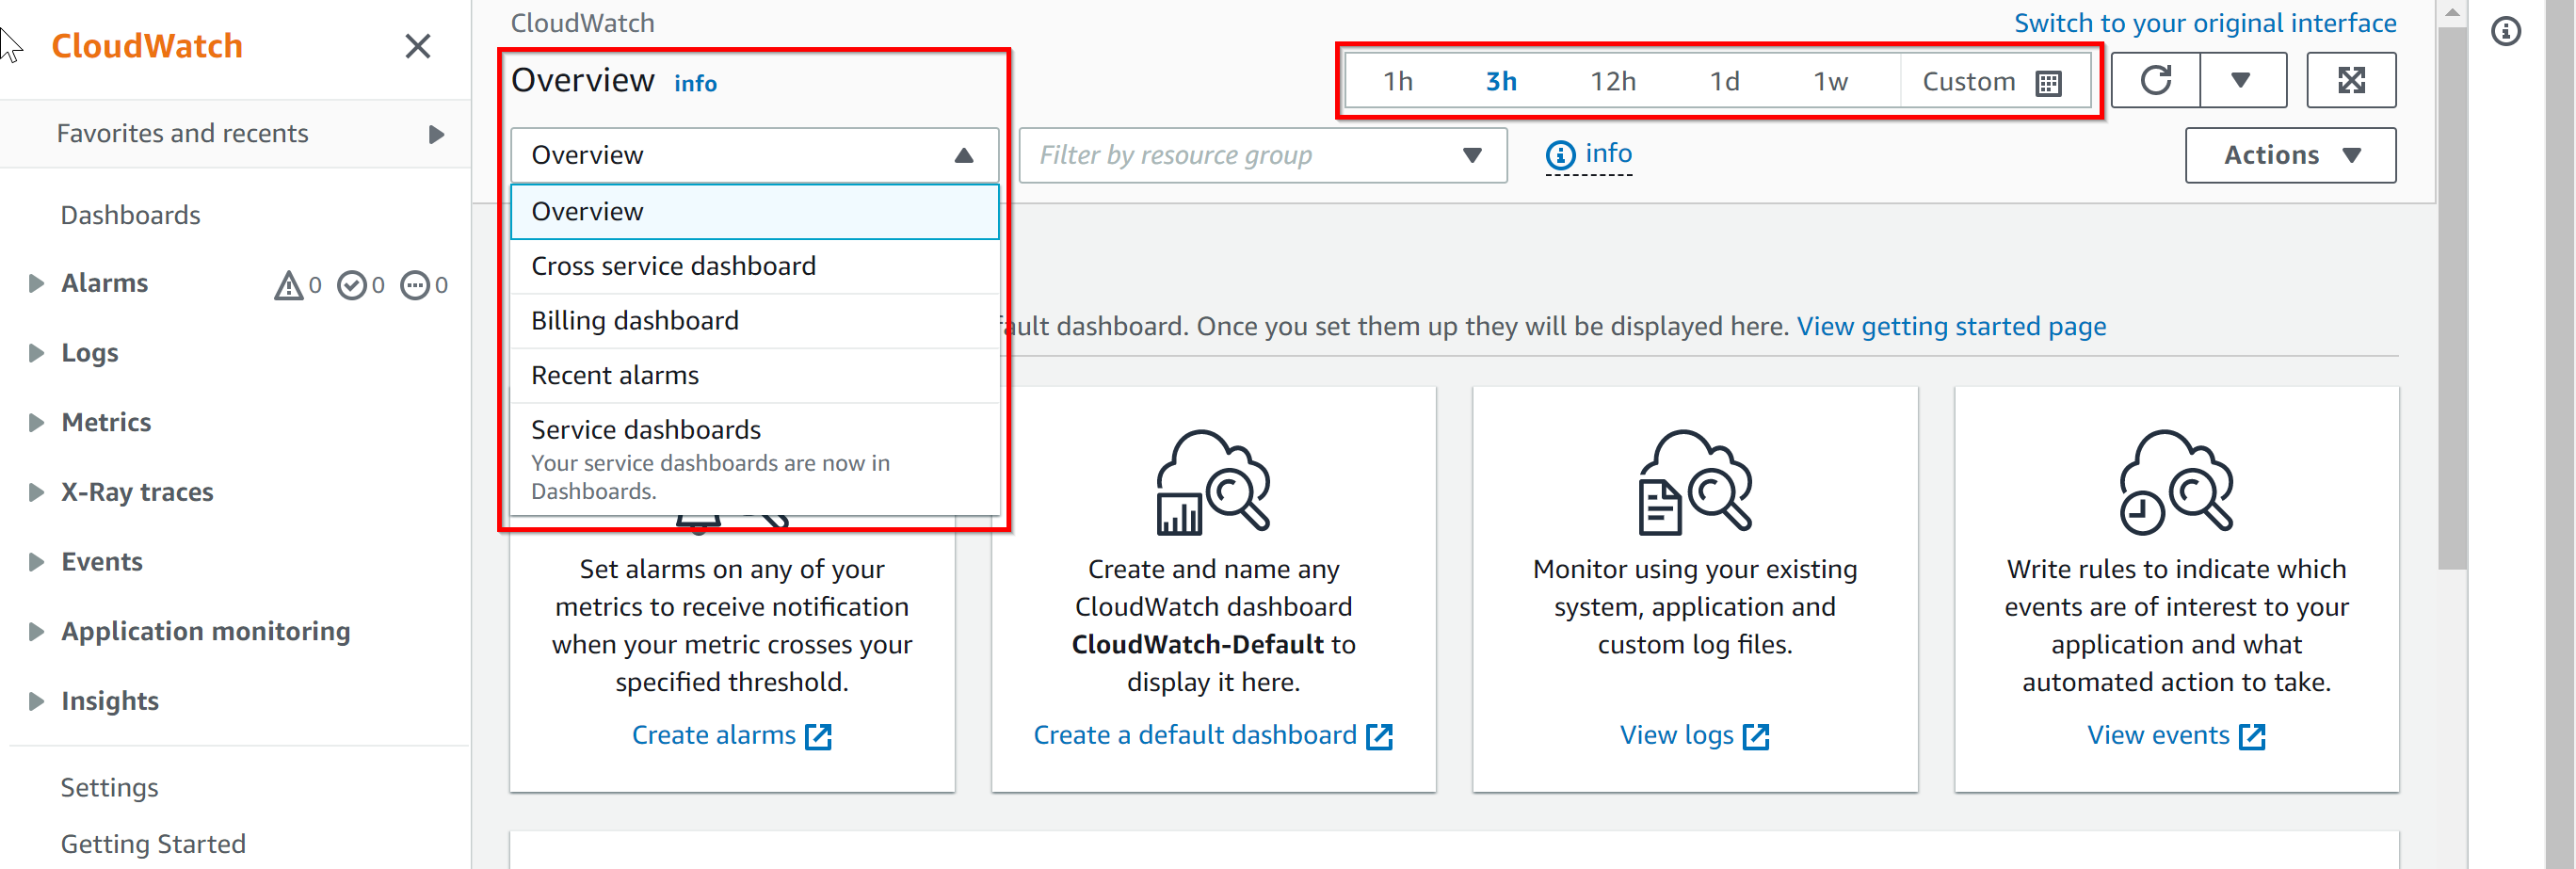
- Cross service dashboard by default shows key metrics from all AWS services you currently using.
- Billing dashboard is useful to see billing and estimated charges as well based on usage statistics.
- From Recent alarms view, you can see recent alarms raised within the time range chosen.
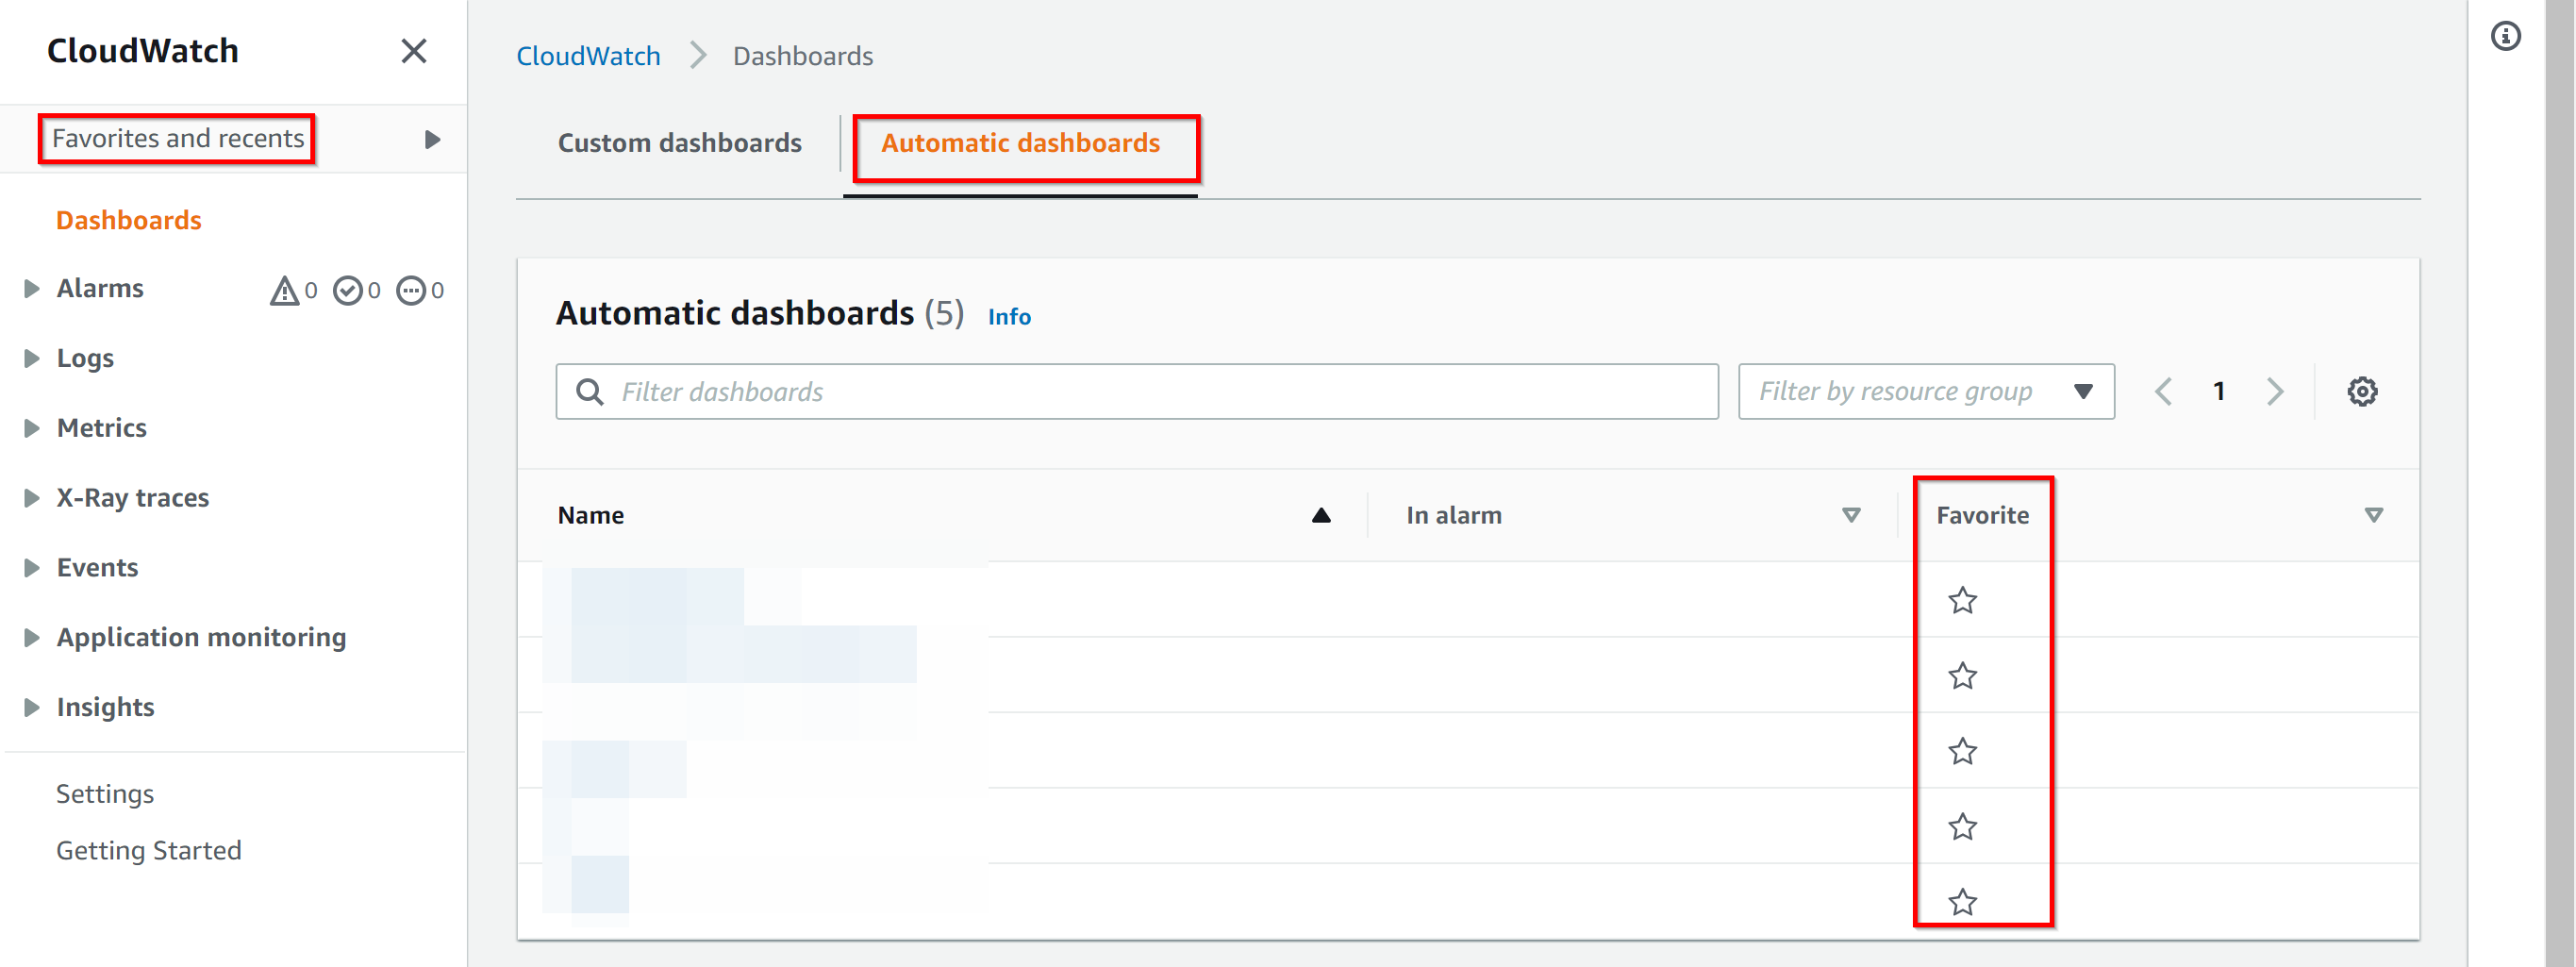
- Service dashboards takes you to automatic dashboards created by AWS for the services that you are using. You can also bookmark them as favorites, by doing so they can be accessed from Favorites and recents menu from left panel.
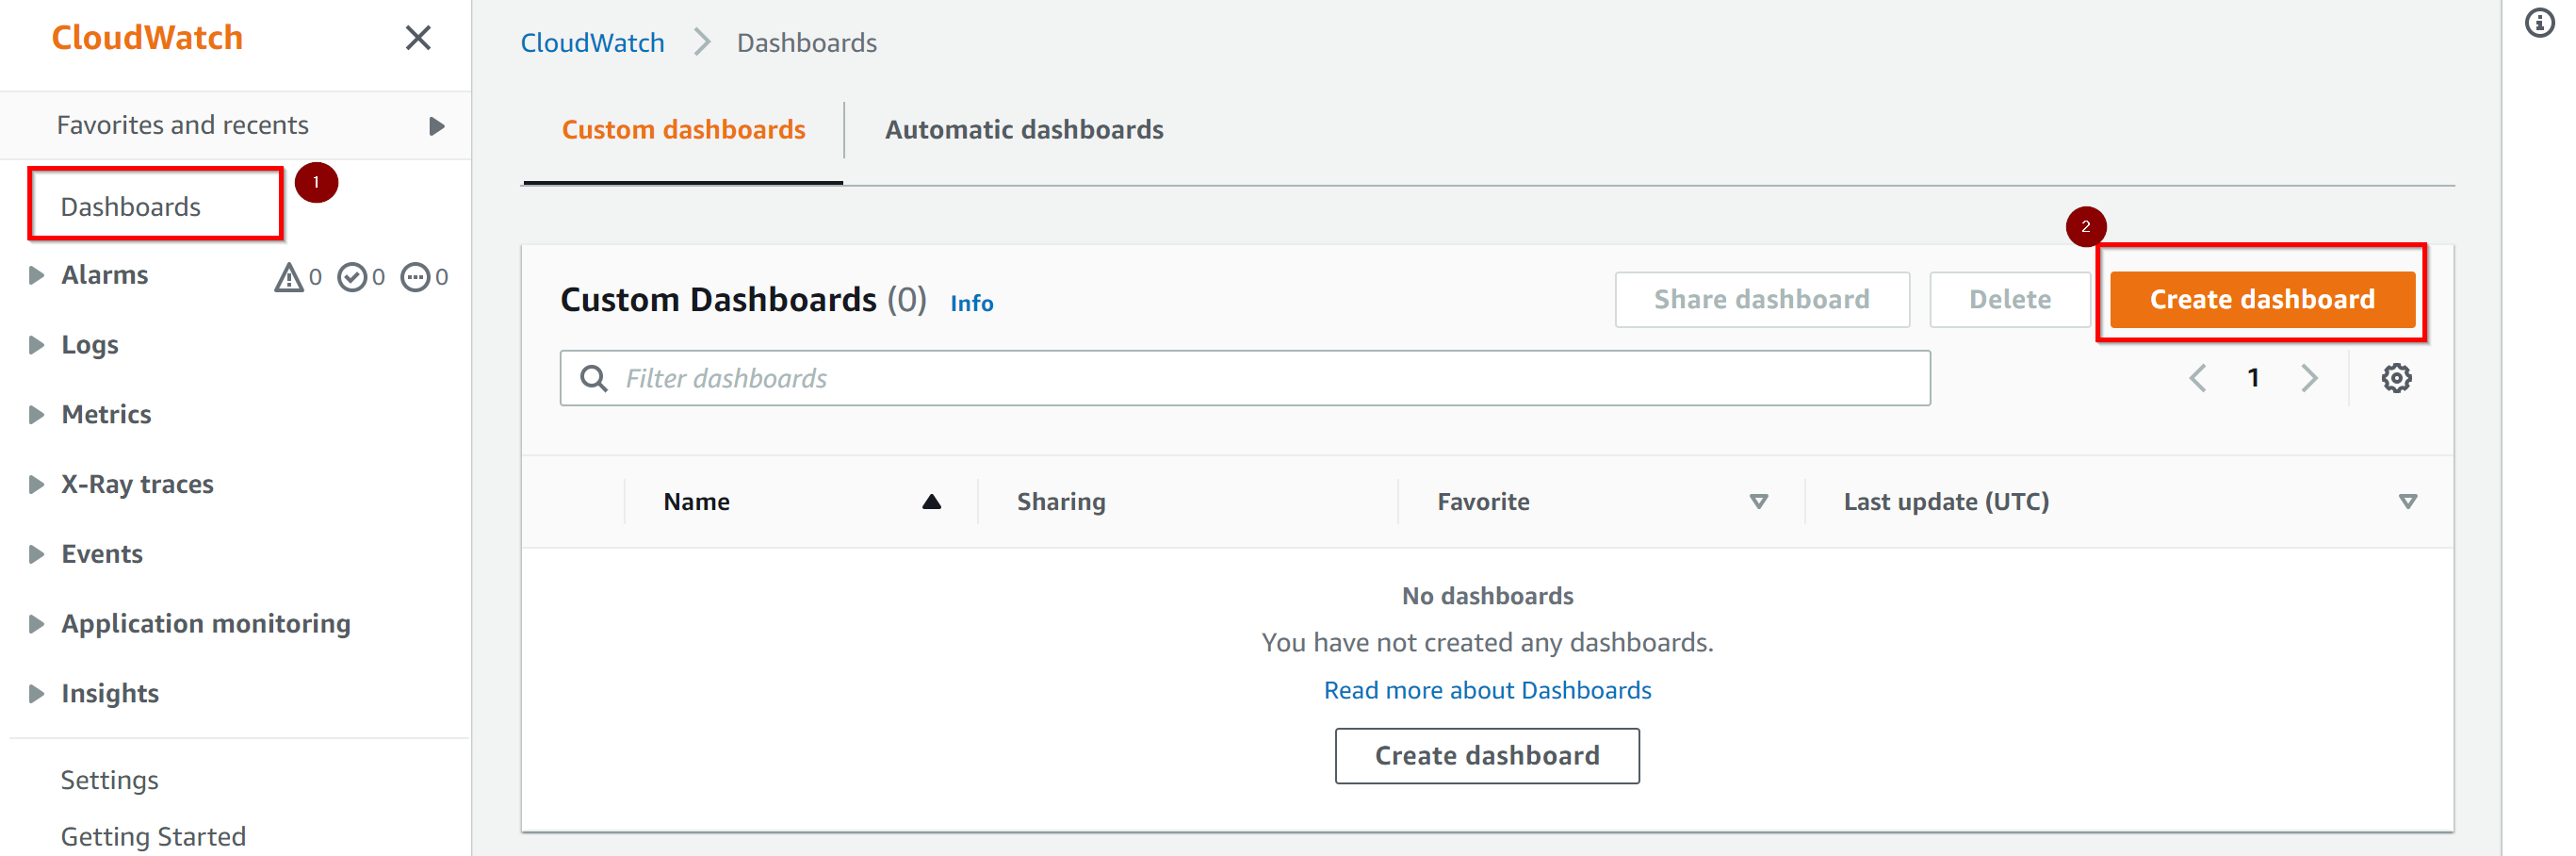
In addition to automatic dashboards that AWS creates, you can also create custom dashboards for your needs.
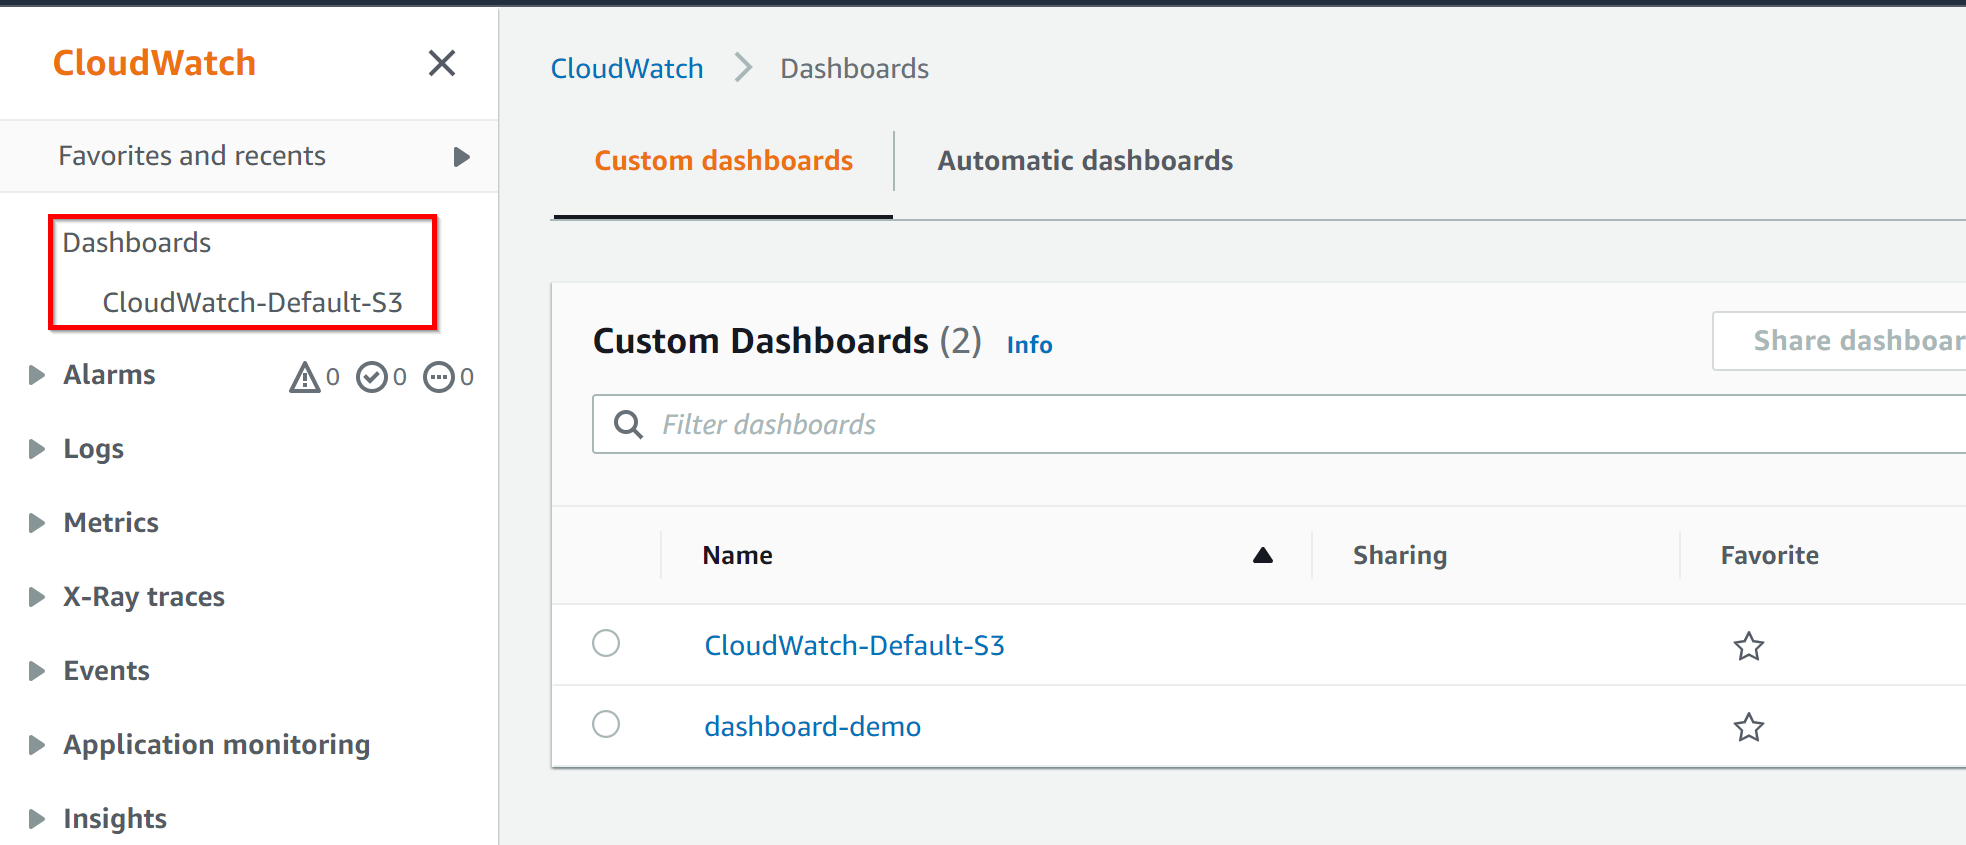
- Navigate to Dashboards menu from the left panel and click on Create dashboard.
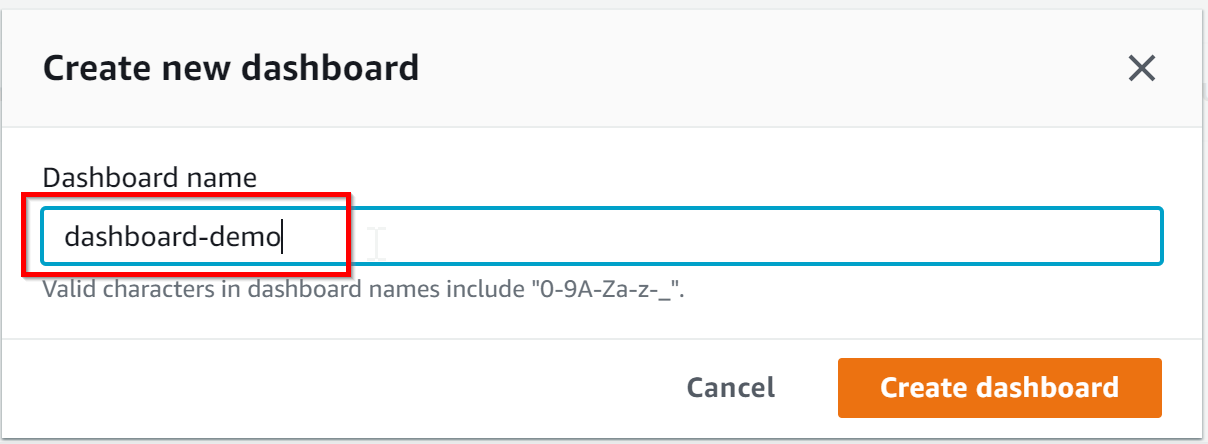
- Provide a name to the dashboard and hit create dashboard. For the illustration purpose, I'm using dashboard name as dashboard-demo.
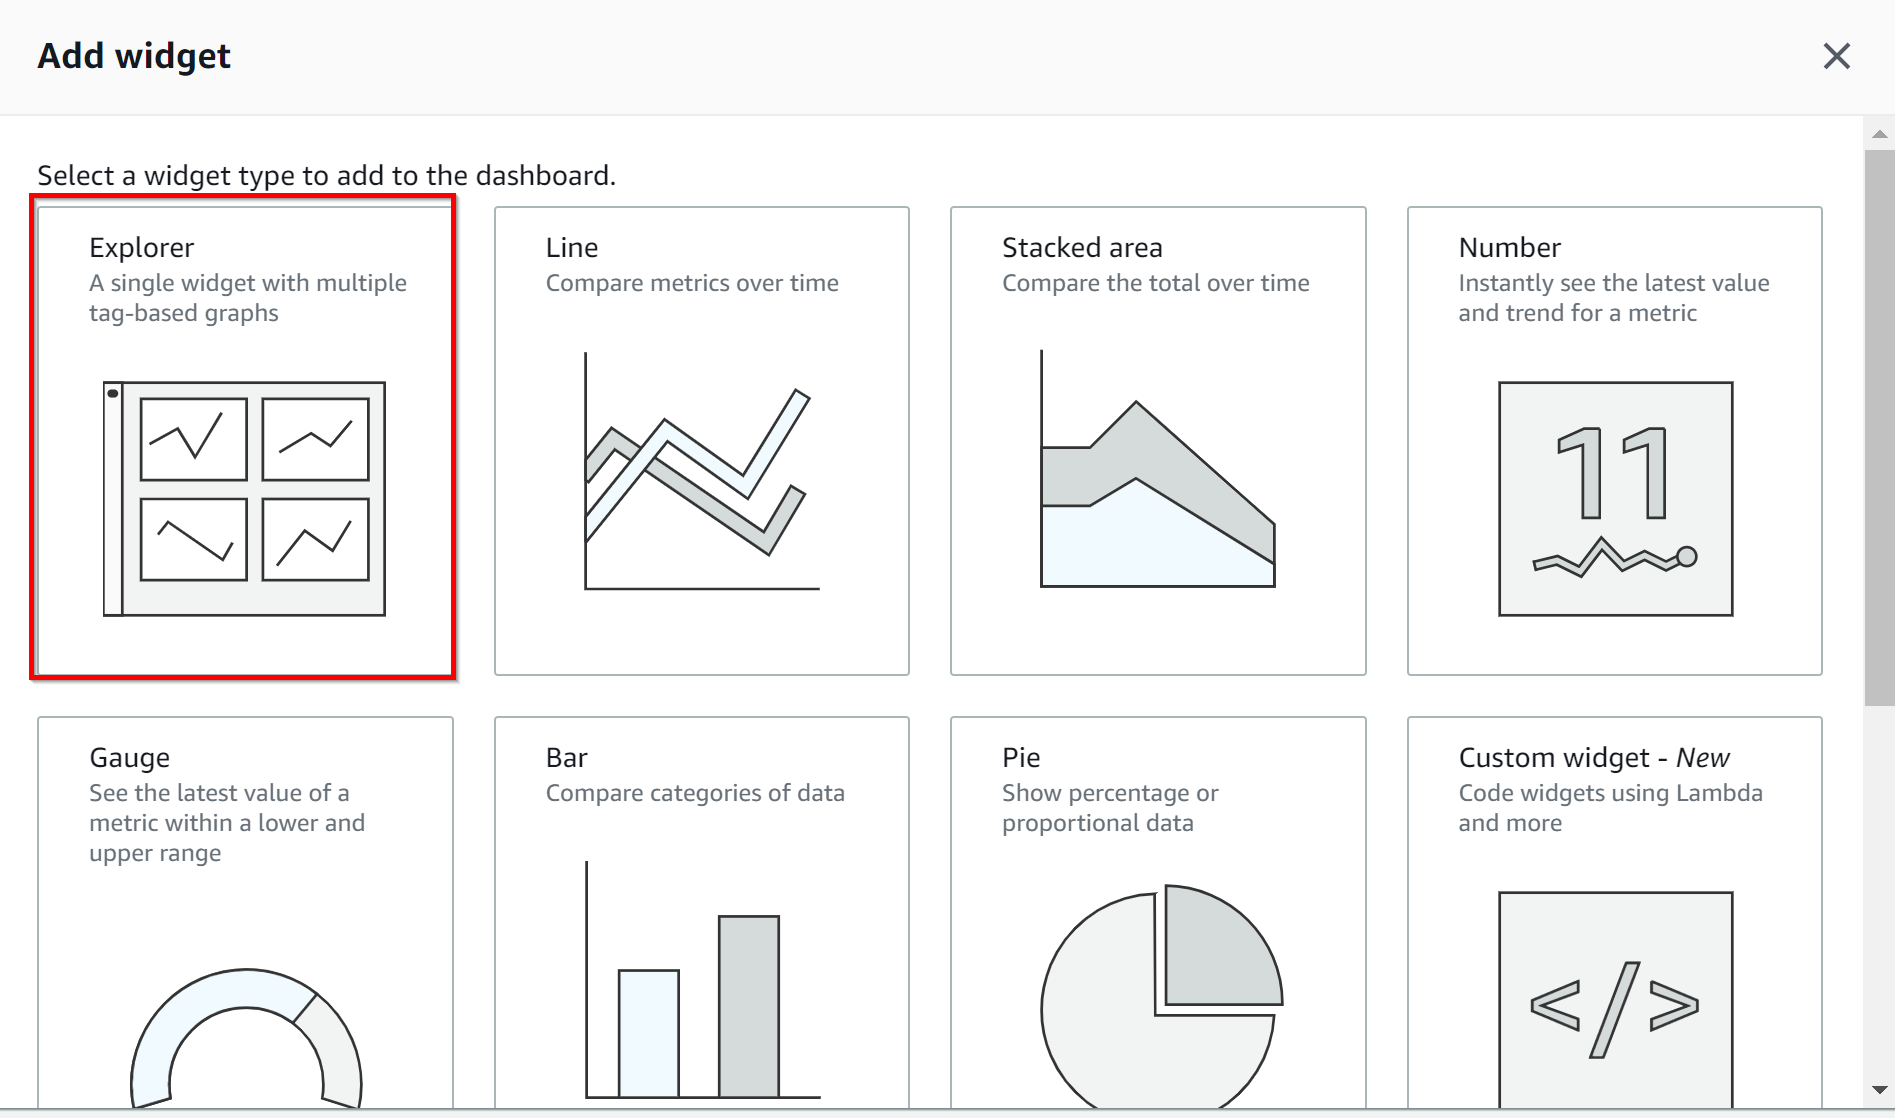
- Next, you can select a widget to show on the dashboard, you can select from default ones from the options and for illustration purpose you can choose Explorer.
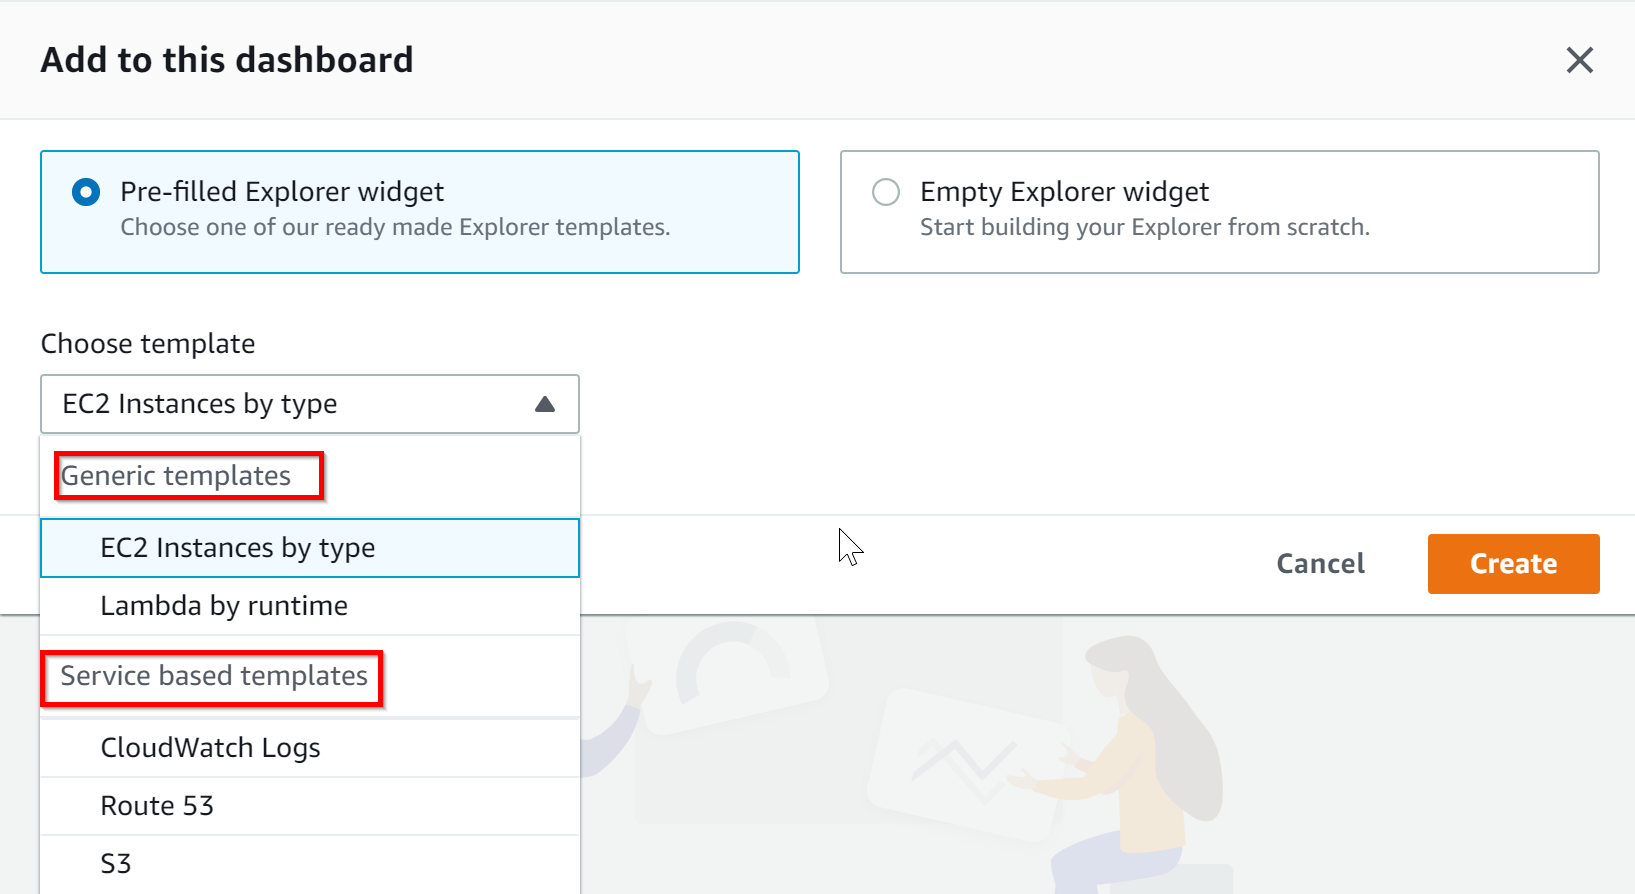
- From the next screen, Choose either Pre-filled Explorer widget or Empty Explorer widget. For illustration purpose we are going to use pre-filled widgets, it shows two categories Generic templates which are pre filled with options or Service based templates for the services you currently using.
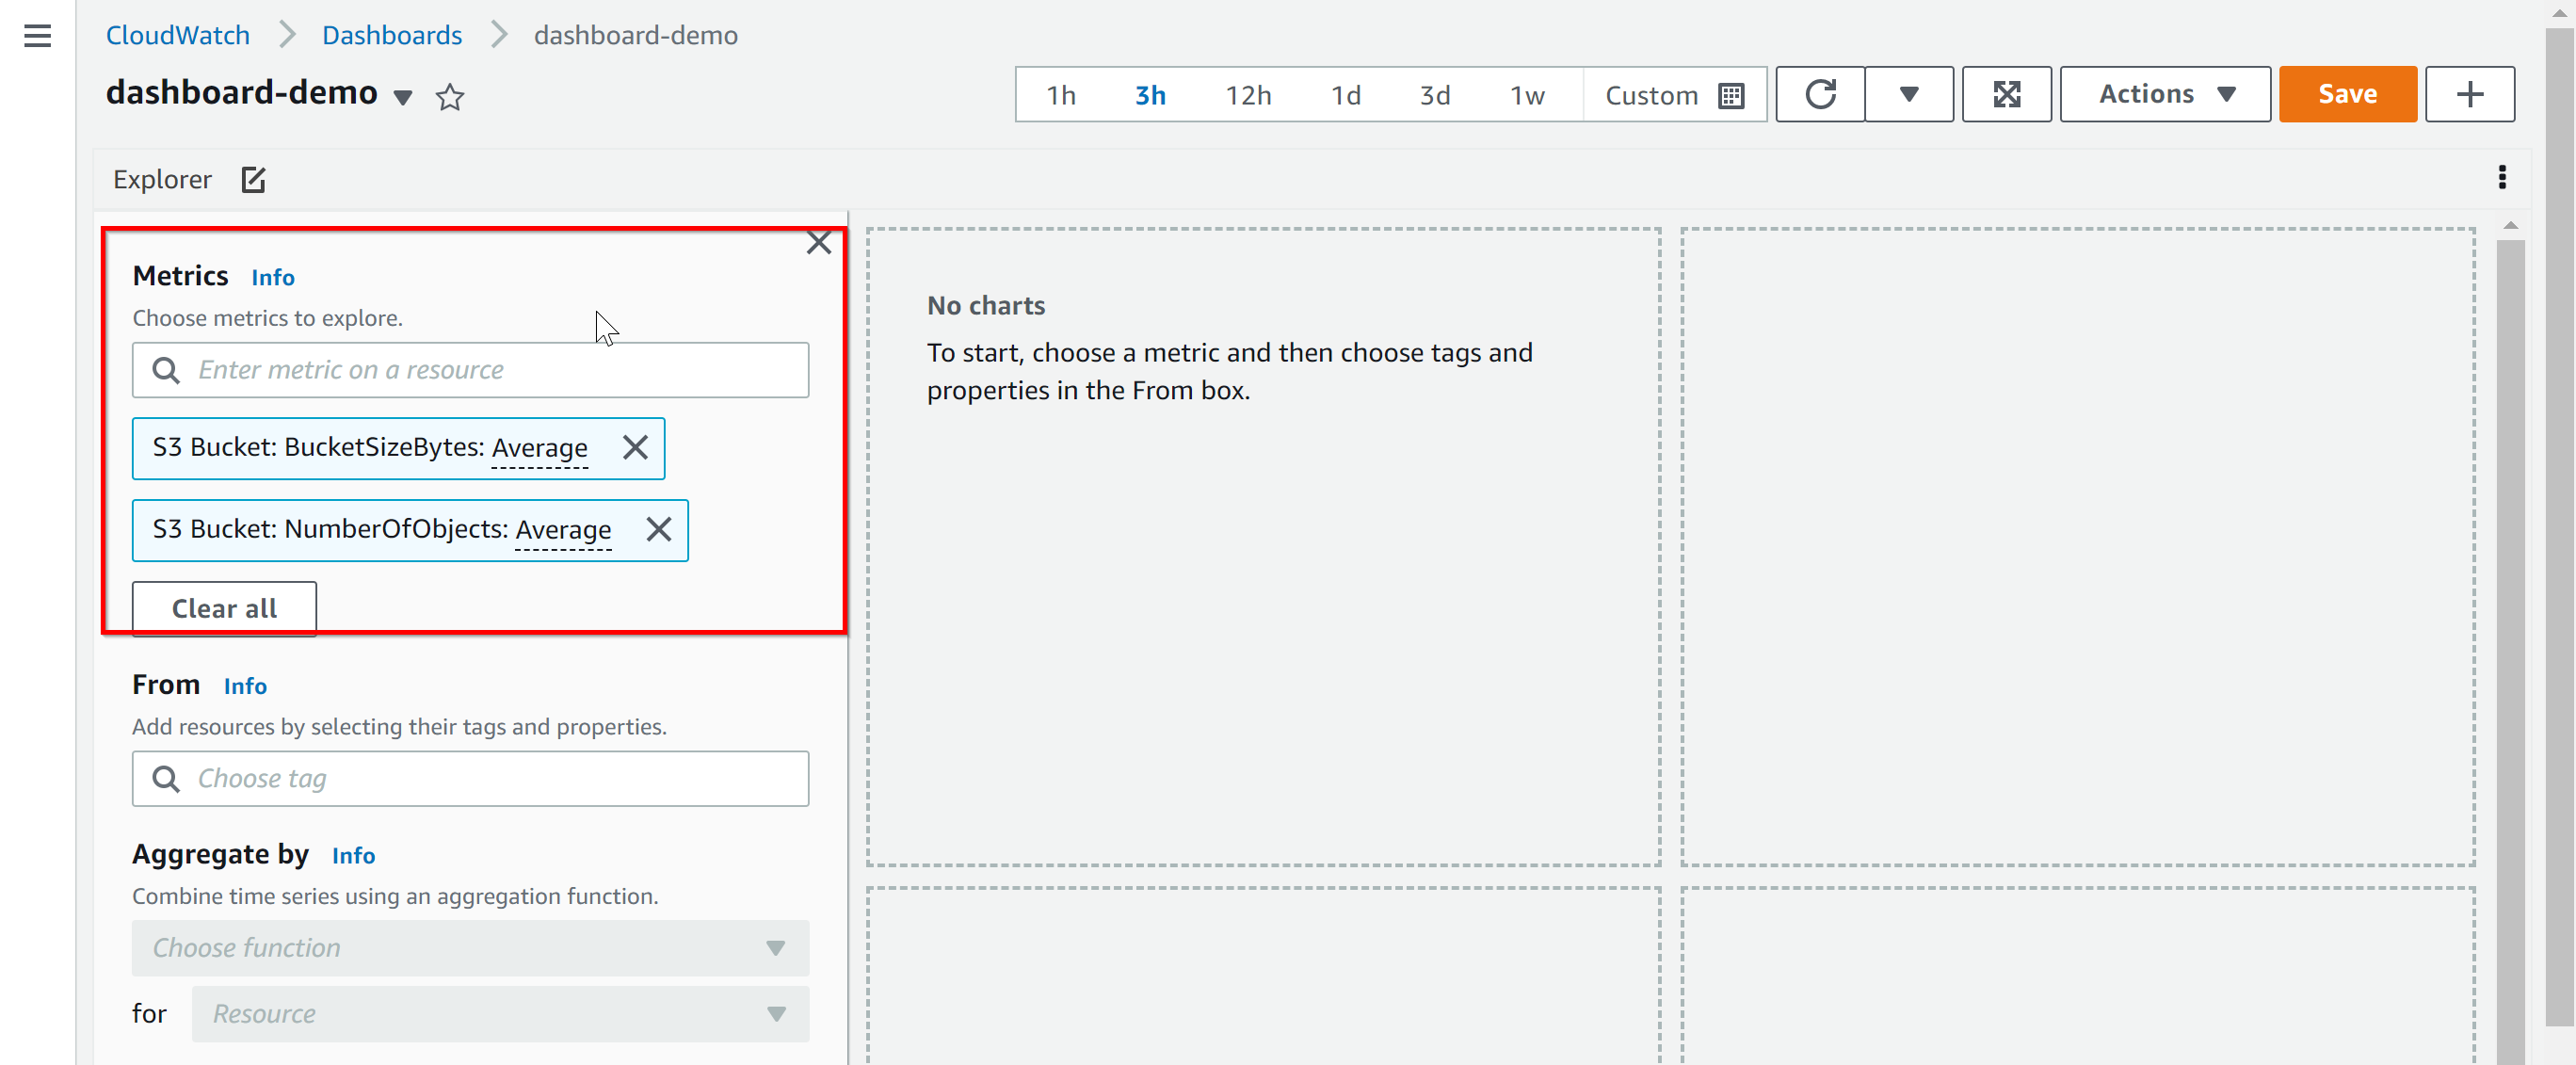
- In the next section, select the metrics you want to display for the dashboard and you can further modify the selection criteria using below options.
If you provide a name starts with CloudWatch-Default-ResourceGroupName or CloudWatch-Default this automatically appears under Dashboards menu. As you see below, though i have more than one dashboard, it shows the dashboard name start with CloudWatch-Default as default one.
- From : in order to use this field, you need to tag AWS resources. For example you can tag an S3 bucket and use that here.
- Aggregated by : these are different aggregate functions like average , max and min etc.
- Split by : this shows separate graphs for each resource tag
- Once you select all the options for the widget, hit Save.